The Quote You See Is Not the Trade You Get

Introducing Enso Shield, and the data behind it
Most users don’t question the number they see on a DEX aggregator. They assume it reflects what the transaction will actually return. It often doesn’t.
Across DeFi, aggregators consistently overquote expected outcomes relative to what execution actually delivers. The gap is sometimes small, sometimes material, and occasionally extreme. In one recent case, a single swap was overquoted by a 3.2% difference between the quoted return and the simulated execution.
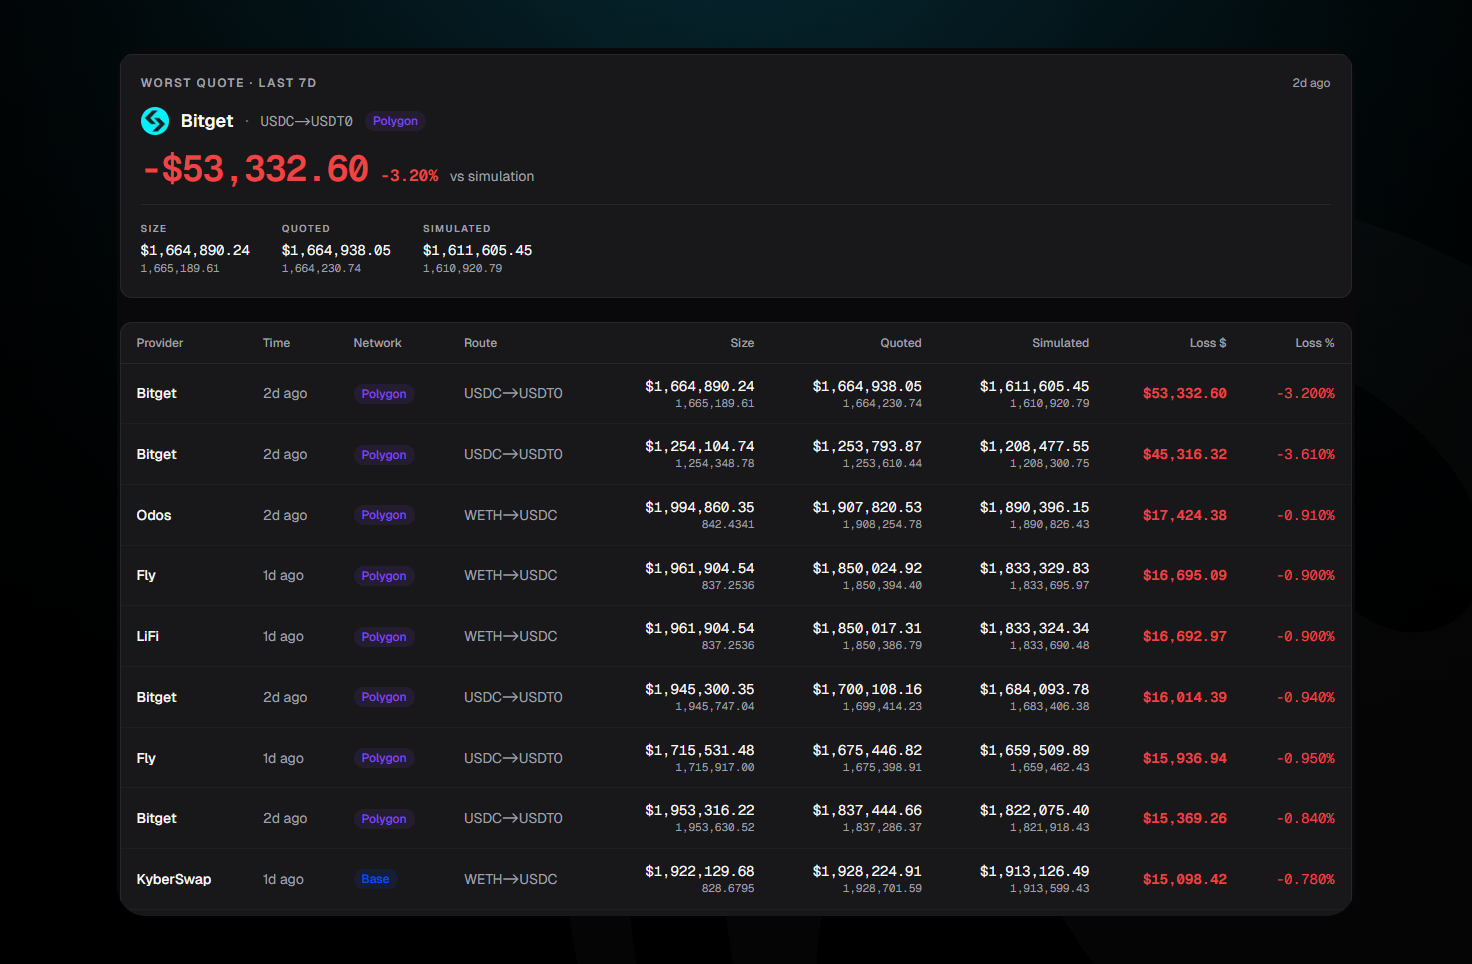
To put that into perspective, 3.2% is roughly what a user might expect to earn over an entire year supplying on Aave. In a single transaction, that yield can disappear purely due to quote inaccuracy.
This is not an edge case. It is a structural issue in how aggregators present expected outcomes and how much users trust them.
Enso Shield has been live since day one
Every project that integrates Enso has always gotten simulation and payload validation baked in. Before any transaction executes, we run it via eth_call against the live chain state. Before any payload is signed, we confirm it matches what was simulated.
We called this Enso Shield. Most of our partners just called it the API working correctly.
We built the Enso Shield Benchmark Dashboard to make visible something we've been measuring internally for over two years: the gap between what aggregators quote and what they actually deliver.
Two layers, one pipeline
Simulation (Quoter): Runs the transaction against live chain state via eth_call. Returns the actual expected output, not an estimate, a simulation, in ~30ms.
Validation (Guard): Confirms that the unsigned transaction a user is about to sign matches the simulated one. Closes the window between the quote and the signature where payload tampering can occur.
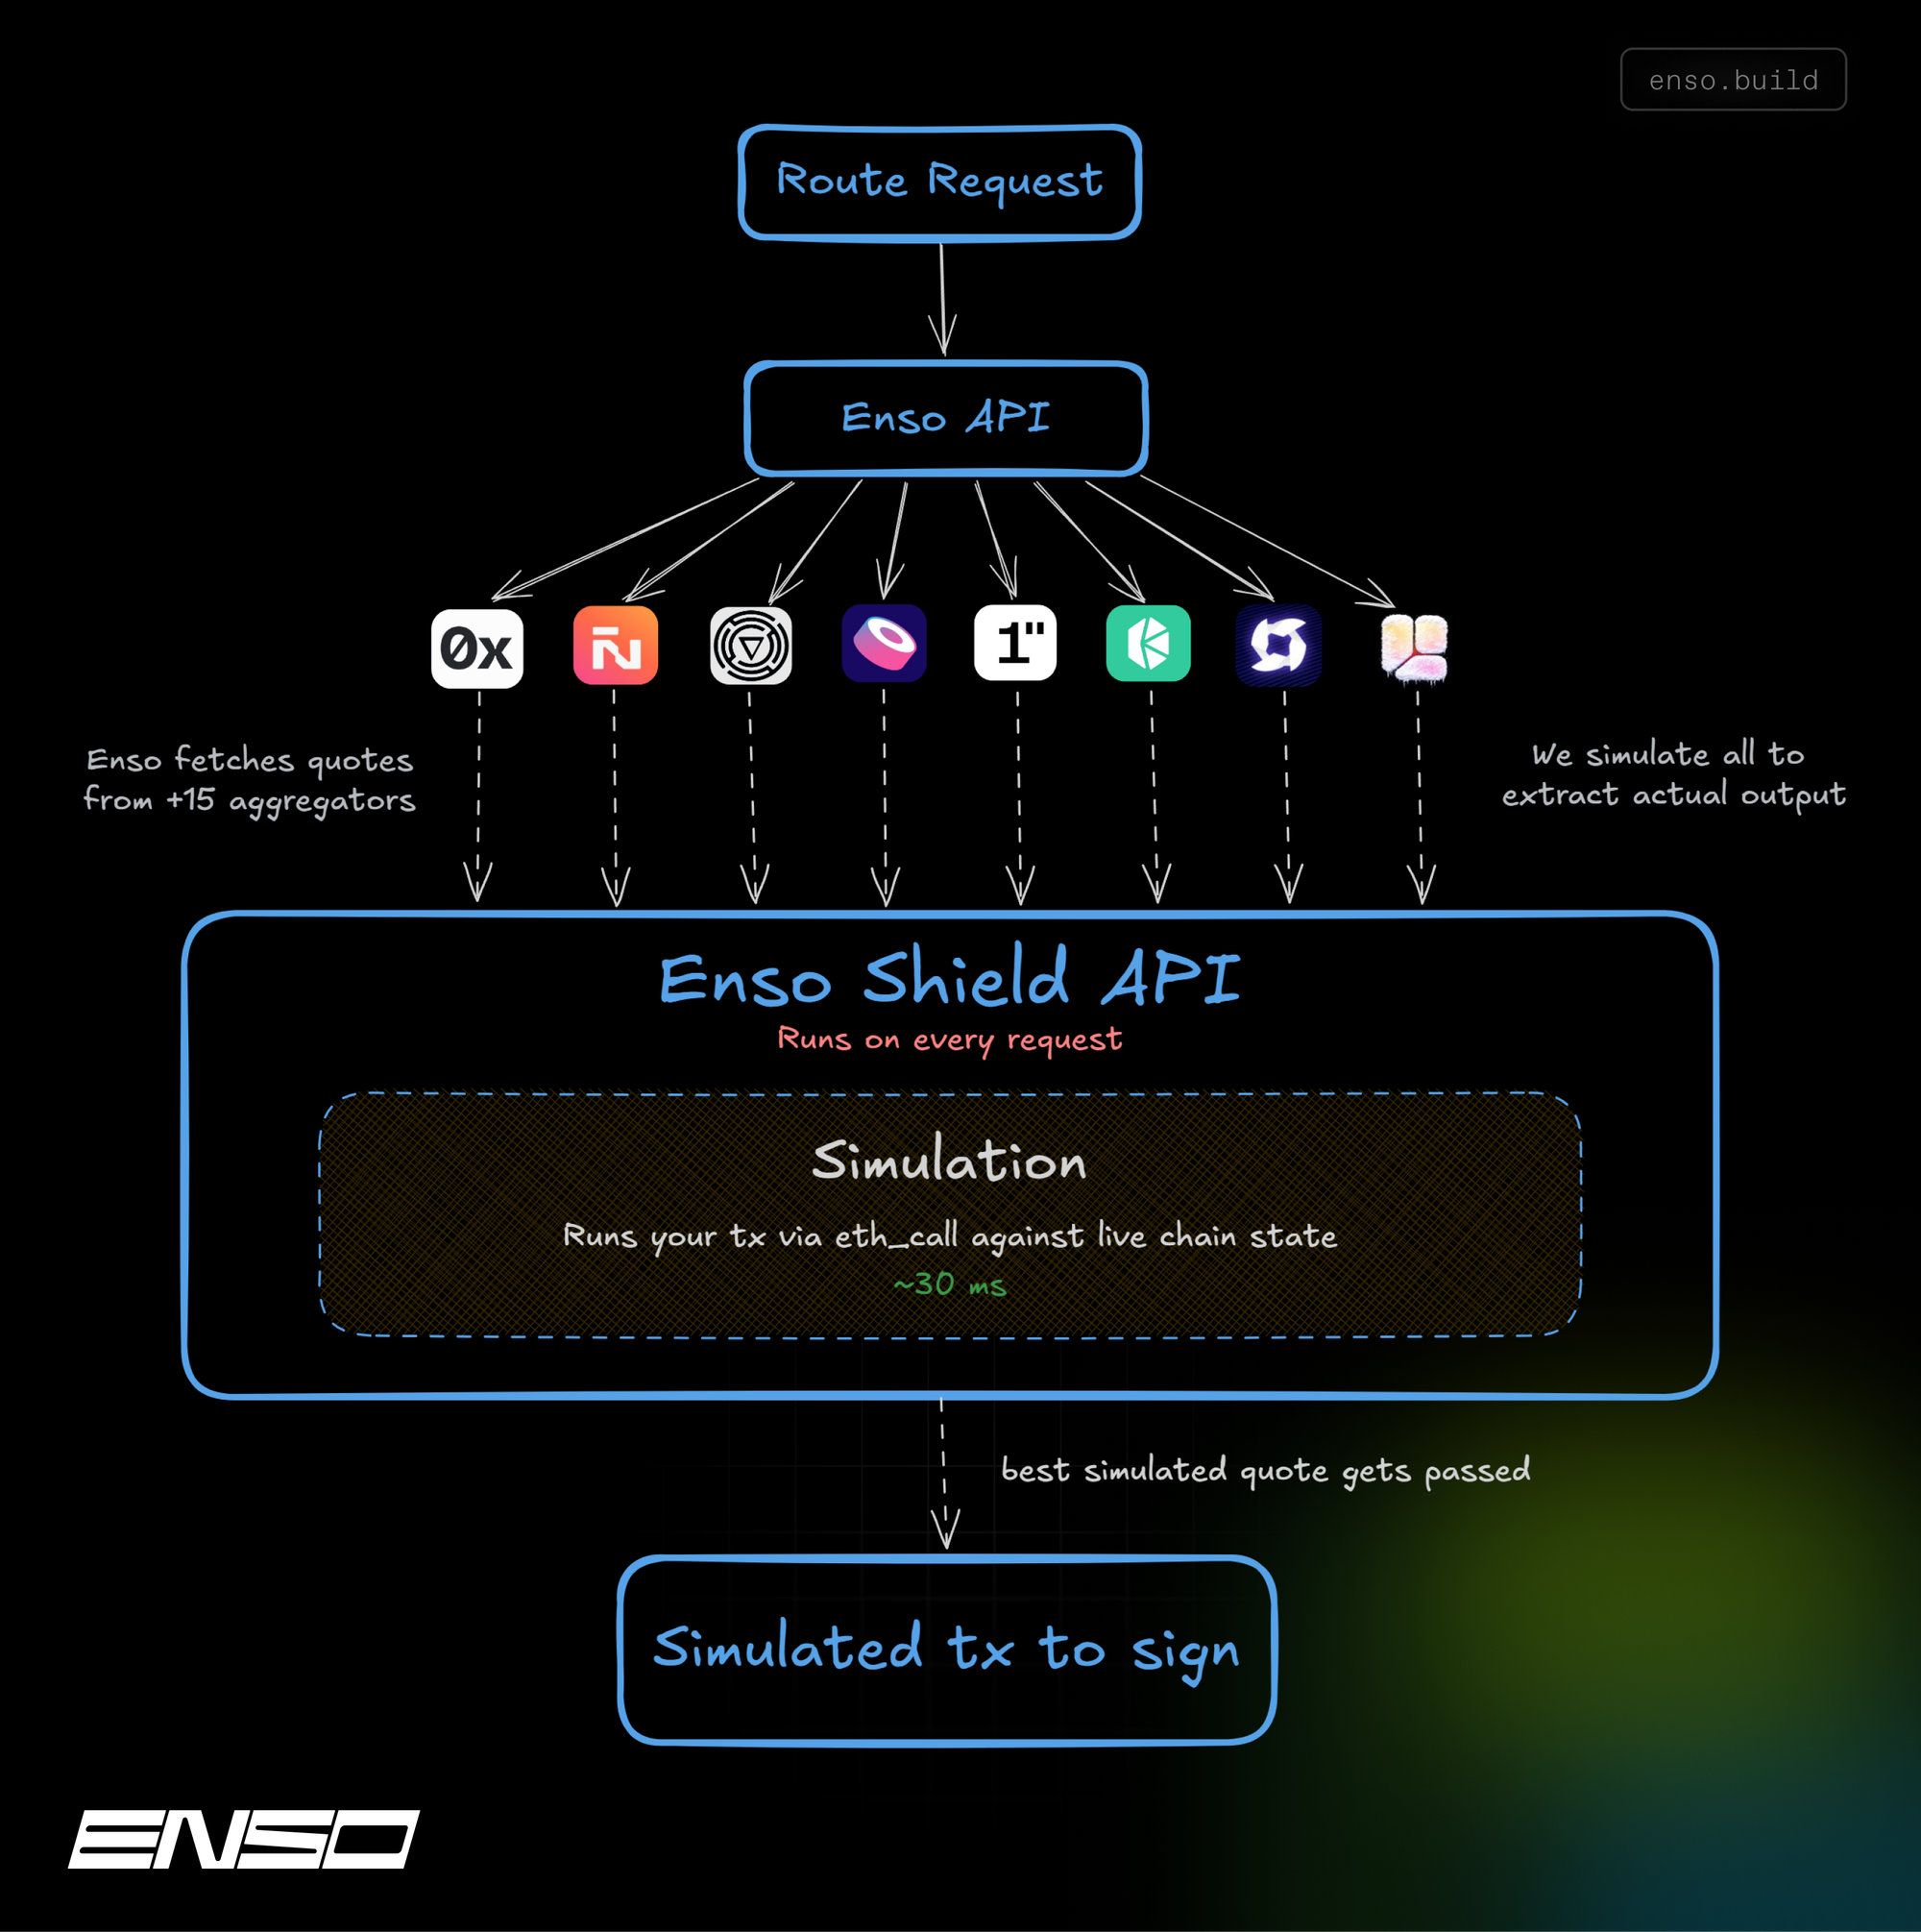
Together: full chain of custody from quote to execution. Two API calls. Works at any volume.
Methodology
Enso Shield benchmarks aggregators by comparing what they quote against what their transactions would actually return.
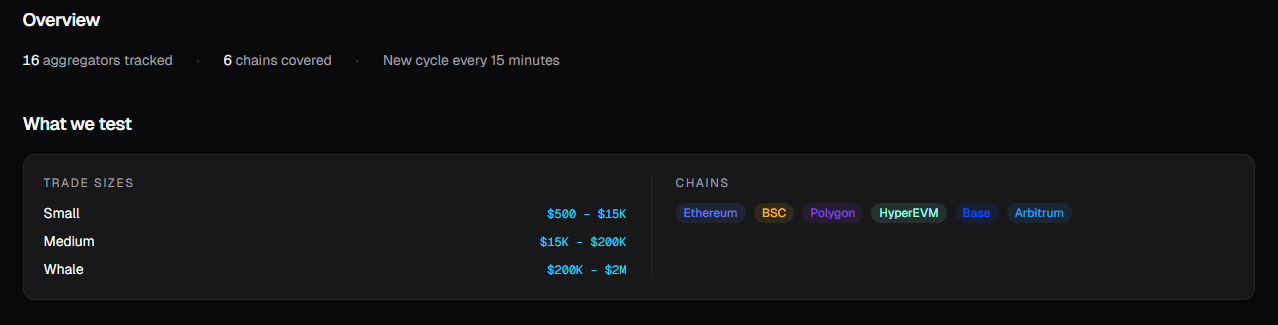
Every 15 minutes, we request quotes from 16 aggregators across 6 chains using identical inputs and fixed 1% slippage. Each quote is then simulated five times via eth_call against a live chain state: immediately after the quote (baseline), and again at +12, +24, +36, and +48 seconds to capture execution decay over time.
We measure the gap between quoted and simulated output, along with latency and execution success. For aggregators that expose their quote block, we also simulate at that block to separate quote accuracy from market movement.
All aggregators receive the same routes, sizes, and conditions. No preferential treatment. Results are continuously updated and reproducible.
Learn more about the full methodology: https://shield.enso.build/methodology
What the dashboard shows
For each route, Shield requests quotes from every integrated aggregator in the same time window, simulates each one under shared constraints, and records the gap between stated quote and verified output.
16 aggregators. 6 chains. Continuously updated.
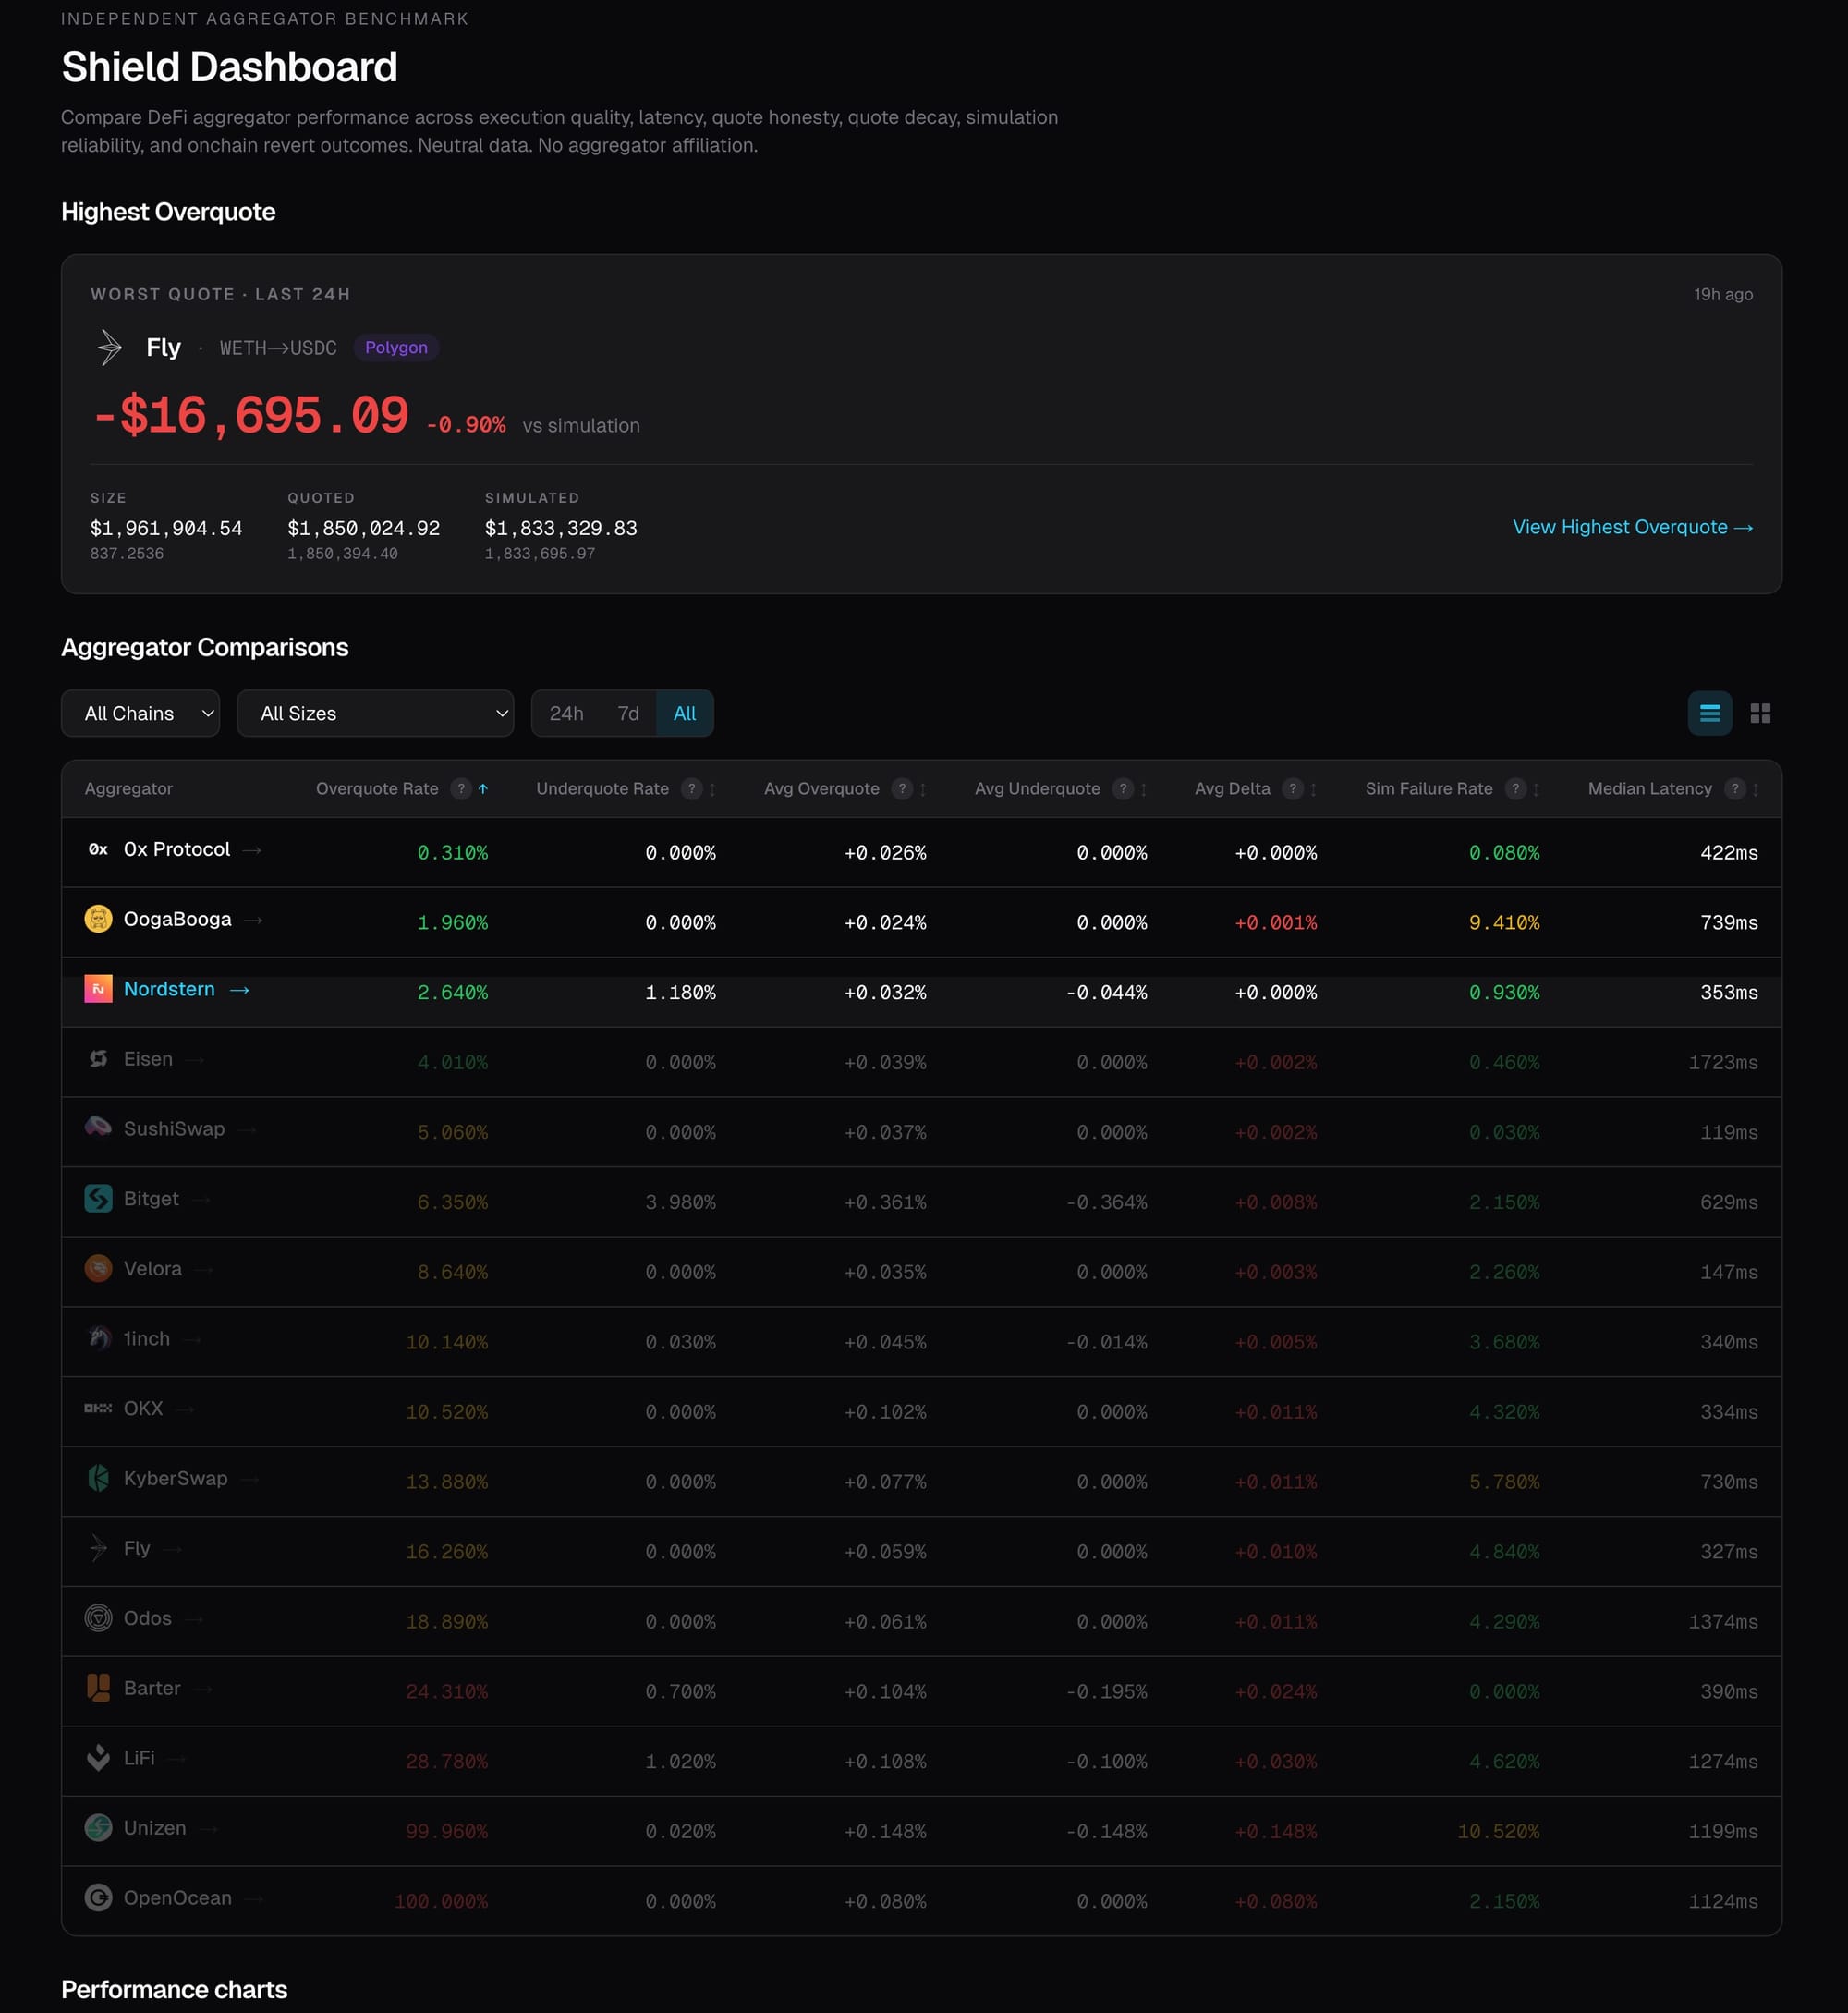
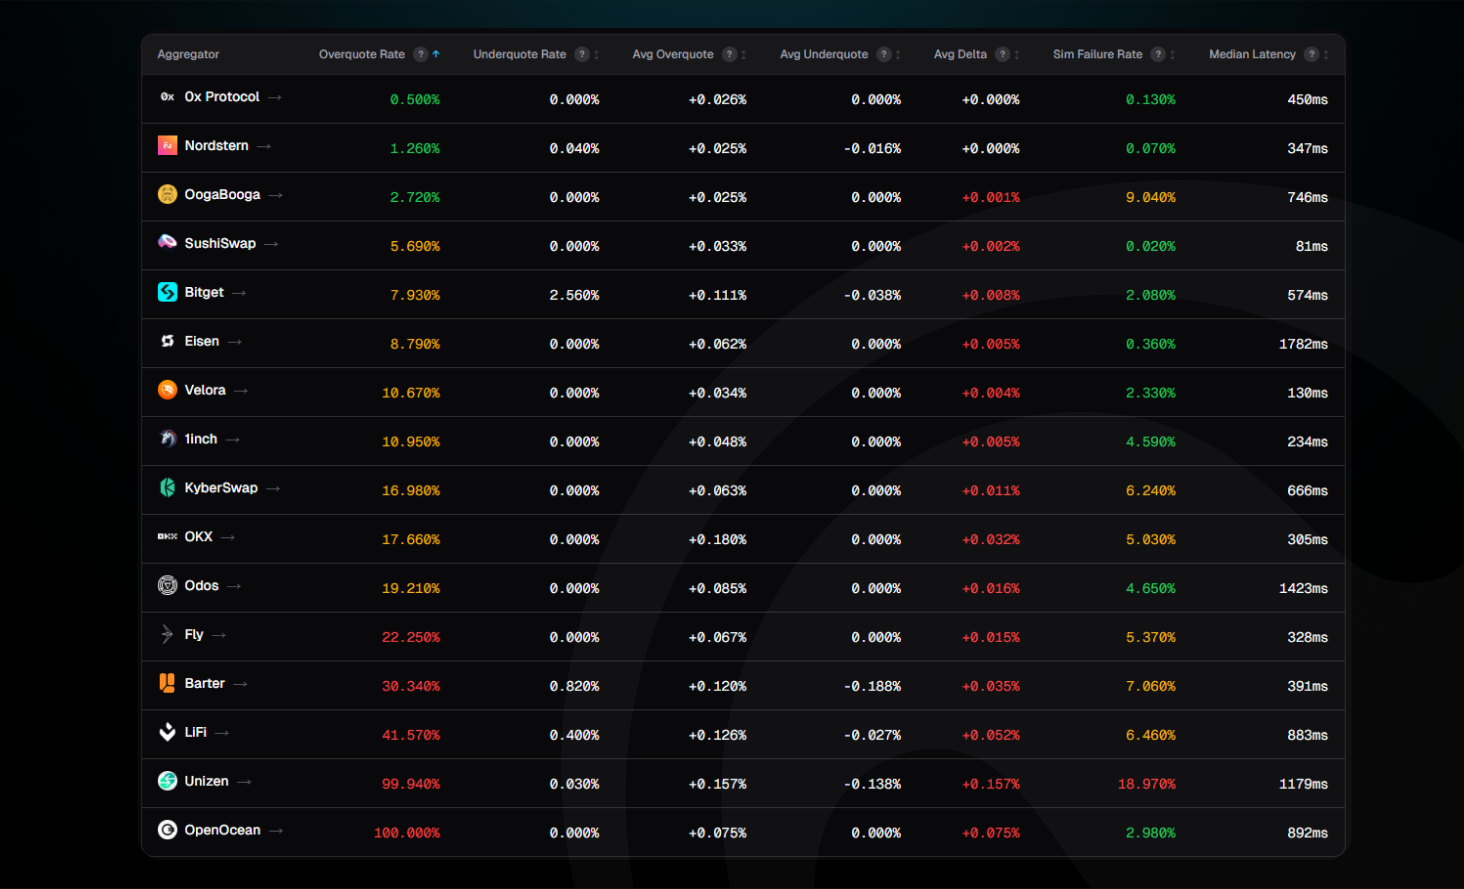
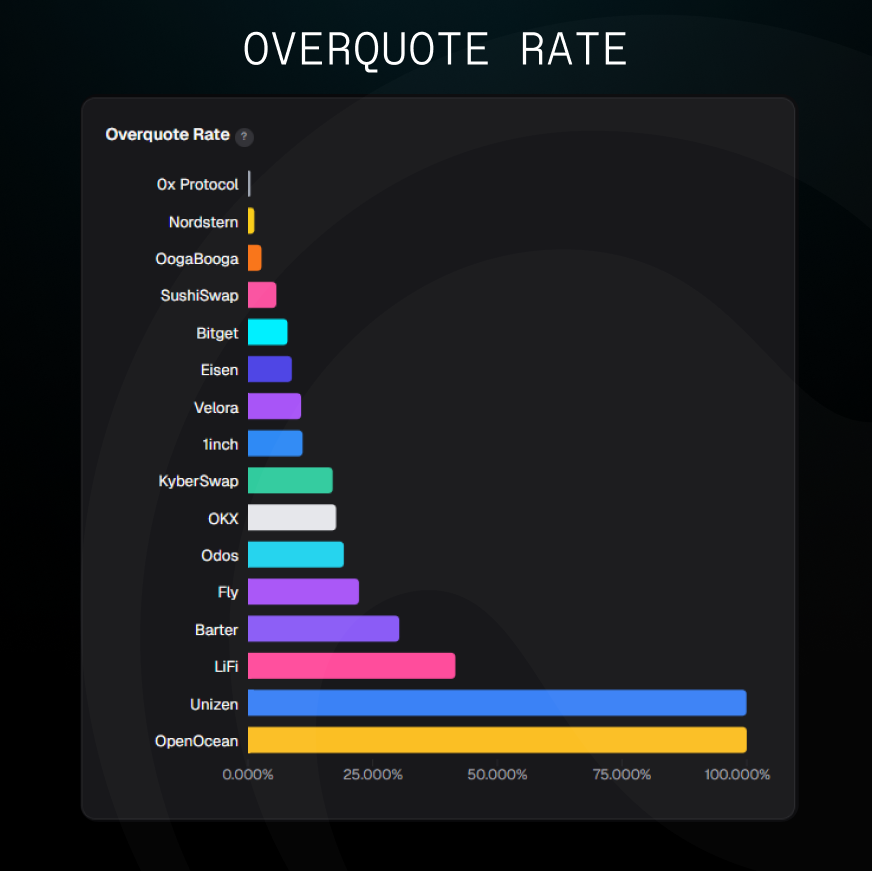
At one end: 0x Protocol at 0.25% overquote rate. At the other end, OpenOcean at 100%, every single quote it issues is inflated relative to what the simulation confirms.
Overquote Rate
Three tiers emerge clearly:
- Tier 1 (under 5%): 0x, OogaBooga, Nordstern, SushiSwap. These quotes are close to what the simulation confirms.
- Tier 2 (5–25%): The middle pack — regularly inflated, some by a small margin, some significantly.
- Tier 3: LiFi, Unizen, and OpenOcean, where inflation is essentially universal.
The signal inside the data: asymmetry
The overquote rate matters. What it's hiding matters more.
Look at the underquote rates:
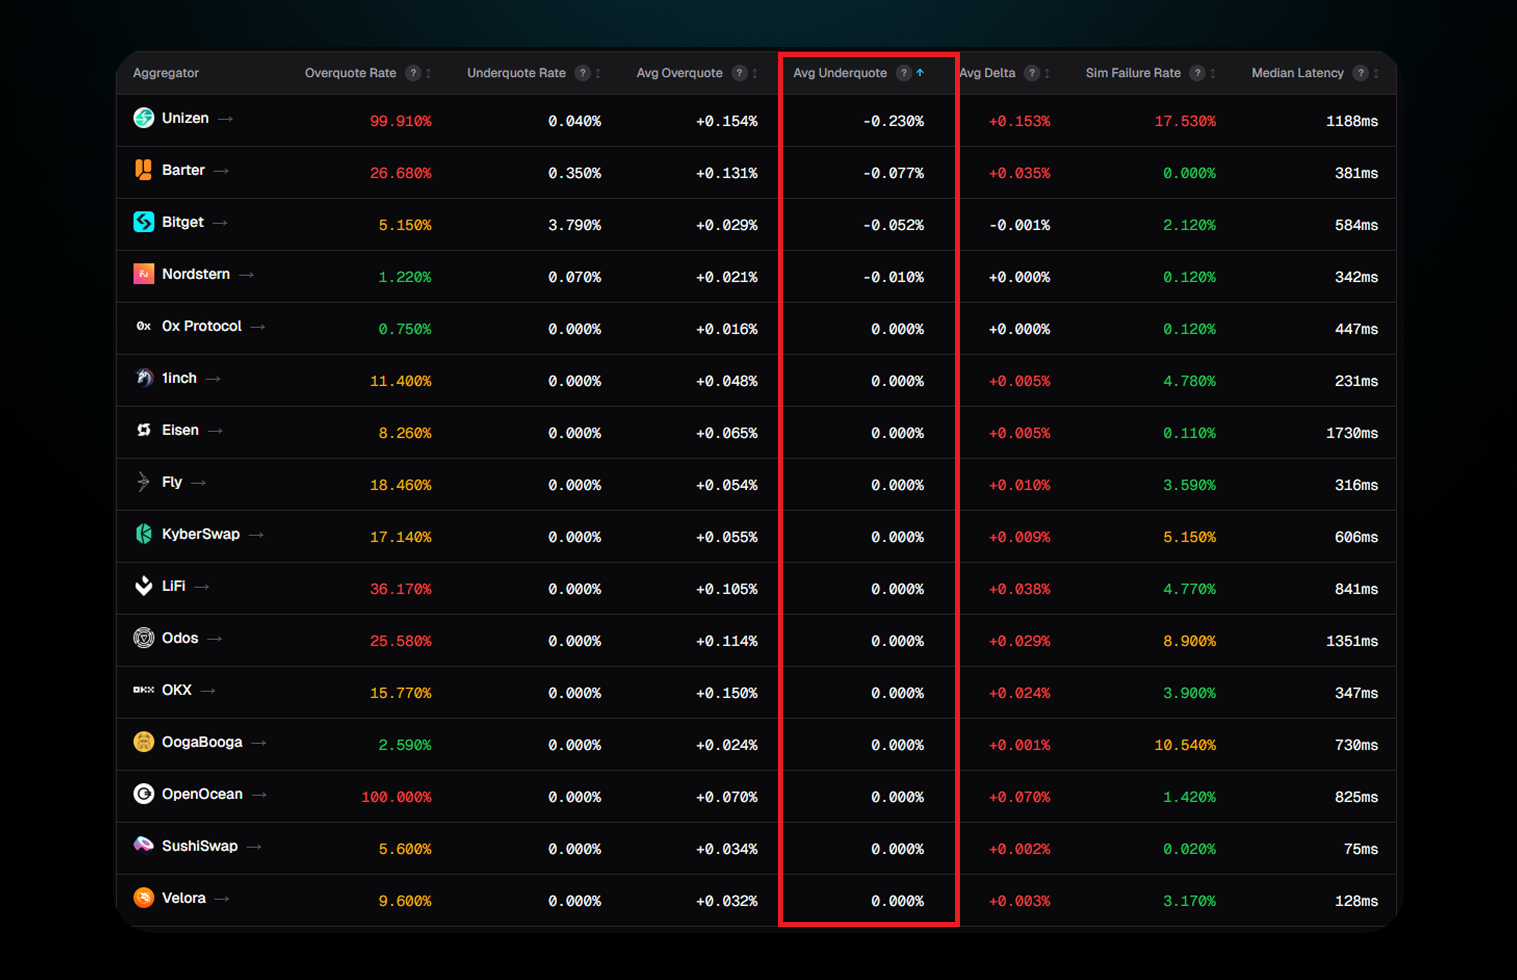
A system with genuine imprecision, routing complexity, timing variance, and chain state noise would overshoot and undershoot roughly equally. These don't. They only err upward.
Overquoting wins comparisons. A user choosing between two routes picks the higher number. An aggregator that consistently inflates without ever underquoting is only optimizing to win routing decisions on paper.
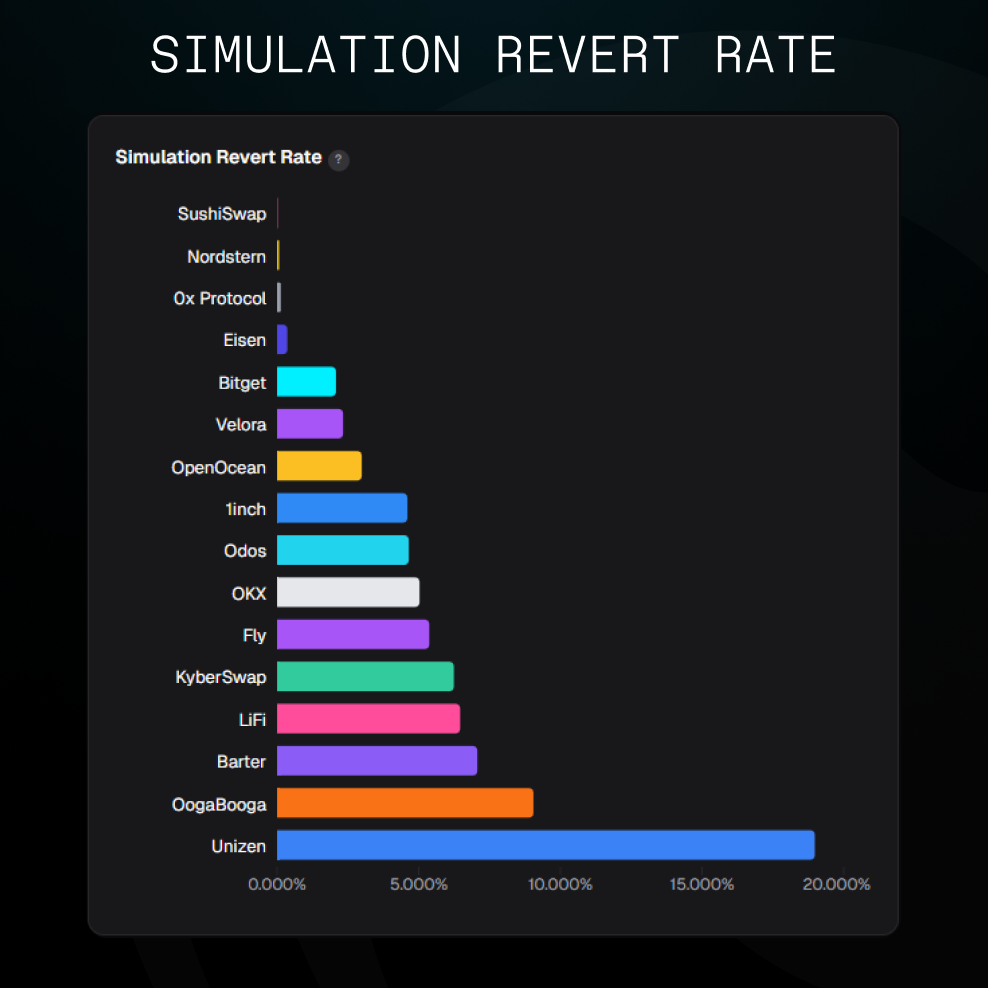
Simulation failure rate: reliability, not just honesty
The dashboard also tracks how often a transaction fails the simulation entirely, a proxy for whether the routes being surfaced are executable.
Sushiswap is the quiet standout: 0% sim failure. Most reliable execution infrastructure on the board. Nordstern, and 0xProtocol also standing comfortably under 0.5%
On the other side, Barter, OogaBooga and Unizen show up with the highest simulation revert rate.
What doesn't change: trade size
Filter to Small ($500–$15K), Medium ($15K–$200K), or Whale ($200K–$2M): the rankings stay the same. The same aggregators occupy the same positions across all size tiers. This behavior is structural, not situational.
For builders
If your platform displays quotes to users, you're vouching for their accuracy. Shield lets you verify before you display, and confirm the payload before signing.
For regulated platforms and institutional deployments, this is the difference between showing users a marketing number and a verified one. Full chain of custody, auditable methodology, reproducible data.
On the data
Enso is not on the leaderboard. We operate as a meta-aggregator; we route through the aggregators we benchmark. No ranking to protect, no incentive to shade the comparison. The methodology is public. Every data point is reproducible.
The dashboard is live. The API has been live for years.